When I first started trading, I suffered from what I call "indicator overload"—my charts looked like a rainbow explosion with dozens of conflicting signals. It wasn't until I stripped everything back and focused on mastering moving averages that my trading transformed from chaotic to consistently profitable.
Moving averages are deceptively simple yet incredibly powerful tools that serve three primary functions:
Trend identification and direction
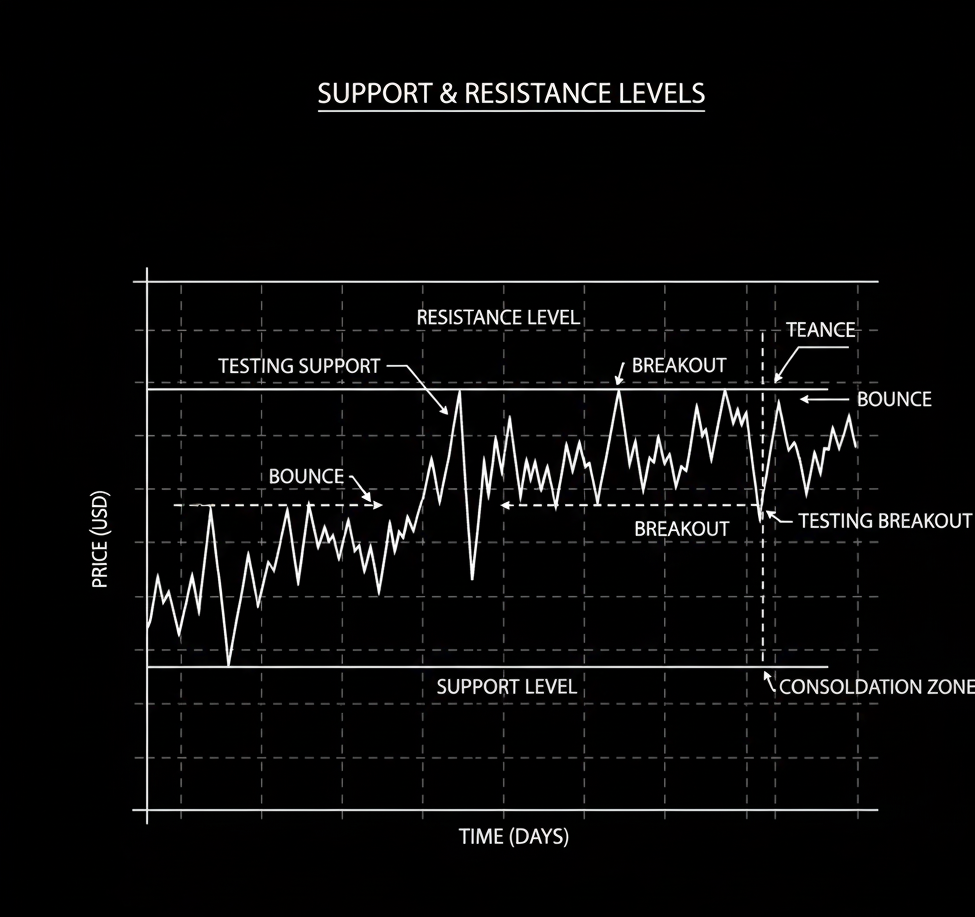
Dynamic support and resistance levels
Trade signal generation through crossovers
The beauty of moving averages lies in their simplicity: they smooth out market noise and reveal the underlying trend direction, acting as your compass in the chaotic seas of price movement.
Understanding Moving Average Types and Calculations
Not all moving averages are created equal. Understanding the differences is crucial:
Simple Moving Average (SMA):
Calculation: Simple arithmetic average of closing prices over specified periods
Characteristics: Smooth, reacts slowly to price changes
Best For: Identifying long-term trend direction
My Usage: 50 and 200-period SMAs for major trend analysis
Exponential Moving Average (EMA):
Calculation: Weighted average that gives more importance to recent prices
Characteristics: More responsive to price changes, follows price more closely
Best For: Short to medium-term trading and dynamic support/resistance
My Usage: 8, 20, and 50-period EMAs for trading signals
Choosing the Right Periods for Your Strategy
After extensive testing, I've settled on these moving average combinations:
For Position/Swing Trading (Daily Charts):
50 EMA: Intermediate trend direction
200 EMA: Primary trend filter
20 EMA: Short-term momentum and entry trigger
For Day Trading (1-Hour/15-Minute Charts):
8 EMA: Immediate trend and quick entries
20 EMA: Dynamic support/resistance
50 EMA: Session trend direction
The 3 Moving Average Setups That Actually Work
Many traders complicate moving averages with unnecessary combinations. These three setups have provided 80% of my moving average-based profits:
Setup 1: The Trend Alignment Method
This is my foundation setup for determining trade direction:
Uptrend Conditions:
Price above 50 EMA
50 EMA above 200 EMA
Both EMAs sloping upward
Downtrend Conditions:
Price below 50 EMA
50 EMA below 200 EMA
Both EMAs sloping downward
I only take trades in the direction of the trend alignment. This simple filter eliminated my tendency to counter-trade and significantly improved my win rate.
Setup 2: The Dynamic Support/Resistance Bounce
This is my bread-and-butter entry technique:
For Uptrends:
Wait for price to pull back to the 20 or 50 EMA
Look for bullish reversal candlestick patterns
Enter on break of reversal pattern high
Stop loss below the moving average and recent swing low
For Downtrends:
Wait for price to rally to the 20 or 50 EMA
Look for bearish reversal patterns
Enter on break of reversal pattern low
Stop loss above the moving average and recent swing high
The key to this setup is patience—wait for the test and confirmation rather than anticipating the bounce.
Setup 3: The Golden Cross/Death Cross
While often discussed, these signals are frequently misunderstood:
Golden Cross (Bullish):
50 EMA crosses above 200 EMA
Not an immediate buy signal
Wait for subsequent pullback to the 50 EMA for better entry
Confirm with price action and volume
Death Cross (Bearish):
50 EMA crosses below 200 EMA
Not an immediate sell signal
Wait for subsequent rally to the 50 EMA for better entry
Confirm with breakdown below support
I've found these crosses work better as trend confirmation rather than entry signals.
Advanced Moving Average Techniques
Multiple Timeframe Alignment:
I require moving average alignment across at least two timeframes:
Primary Trend: Daily chart (50/200 EMA alignment)
Trading Timeframe: 4-hour/1-hour chart (entry signals)
When both timeframes agree, probability increases significantly.
Moving Average Ribbons:
Using multiple EMAs (8, 13, 21, 34, 55) creates a visual "ribbon" that shows trend strength:
Expanding Ribbon: Strong, healthy trend
Contracting Ribbon: Weakening momentum, potential reversal
Twisted Ribbon: Choppy, directionless market
Volume-Weighted Moving Average (VWMA):
This advanced tool places more weight on high-volume periods, making it more responsive to significant price movements. I use it to confirm breakouts and breakdowns.
Risk Management with Moving Averages
Moving averages provide natural points for stop loss placement:
Initial Stop Loss:
For long positions: Below the nearest moving average support
For short positions: Above the nearest moving average resistance
Trailing Stops:
As trends develop, I trail my stops using:
Aggressive: Below the 8 or 20 EMA
Moderate: Below the 50 EMA
Conservative: Below the 200 EMA
Position Sizing:
I adjust position size based on the distance to my moving average stop:
Wider stops = smaller position size
Tighter stops = larger position size (while maintaining 1% risk)
Common Moving Average Mistakes to Avoid
Mistake 1: Using Too Many Moving Averages
Solution: Stick to 2-4 well-chosen periods that serve specific purposes.
Mistake 2: Ignoring Market Context
Solution: Moving averages work best in trending markets. Avoid using them in choppy, ranging conditions.
Mistake 3: Chasing Crossovers
Solution: Wait for price confirmation after crossovers rather than entering immediately.
Mistake 4: Using Inappropriate Timeframes
Solution: Match your moving average periods to your trading style and timeframe.
Mistake 5: Treating MAs as Absolute Levels
Solution: Moving averages are zones, not exact lines. Allow some breathing room for normal volatility.
Developing Your Moving Average Intuition
Mastering moving averages requires developing a feel for how price interacts with them in different market conditions. I recommend:
Historical Analysis:
Study how price has reacted to key moving averages in the past for the instruments you trade.
Paper Trading:
Practice identifying and trading moving average setups without real money at risk.
Journaling:
Record your observations about moving average behavior in different market regimes.
Real-World Example: AAPL Trend Trade
Let me share a recent successful trade:
Setup: AAPL daily chart showed 50 EMA above 200 EMA, both rising
Entry: Price pulled back to 20 EMA on 4-hour chart, formed hammer pattern
Entry Price: $165.50
Stop Loss: $159.80 (below 50 EMA)
Result: Price resumed uptrend, reached $185.40 over 3 weeks
The Limitations of Moving Averages
While powerful, moving averages have limitations:
Lagging nature means they're always behind current price action
Perform poorly in ranging, choppy markets
Can give false signals during periods of high volatility
Should never be used in isolation
I complement moving averages with:
Price action analysis for confirmation
Volume analysis for conviction
Momentum indicators for timing
Support/resistance for context
Moving averages are like the steering wheel of your trading vehicle—they help you stay on course but don't tell you everything about the road ahead. Master them, combine them with other tools, and they'll serve as reliable guides through the markets' twists and turns.

Leave a comment
Your email address will not be published. Required fields are marked *